Now you can;
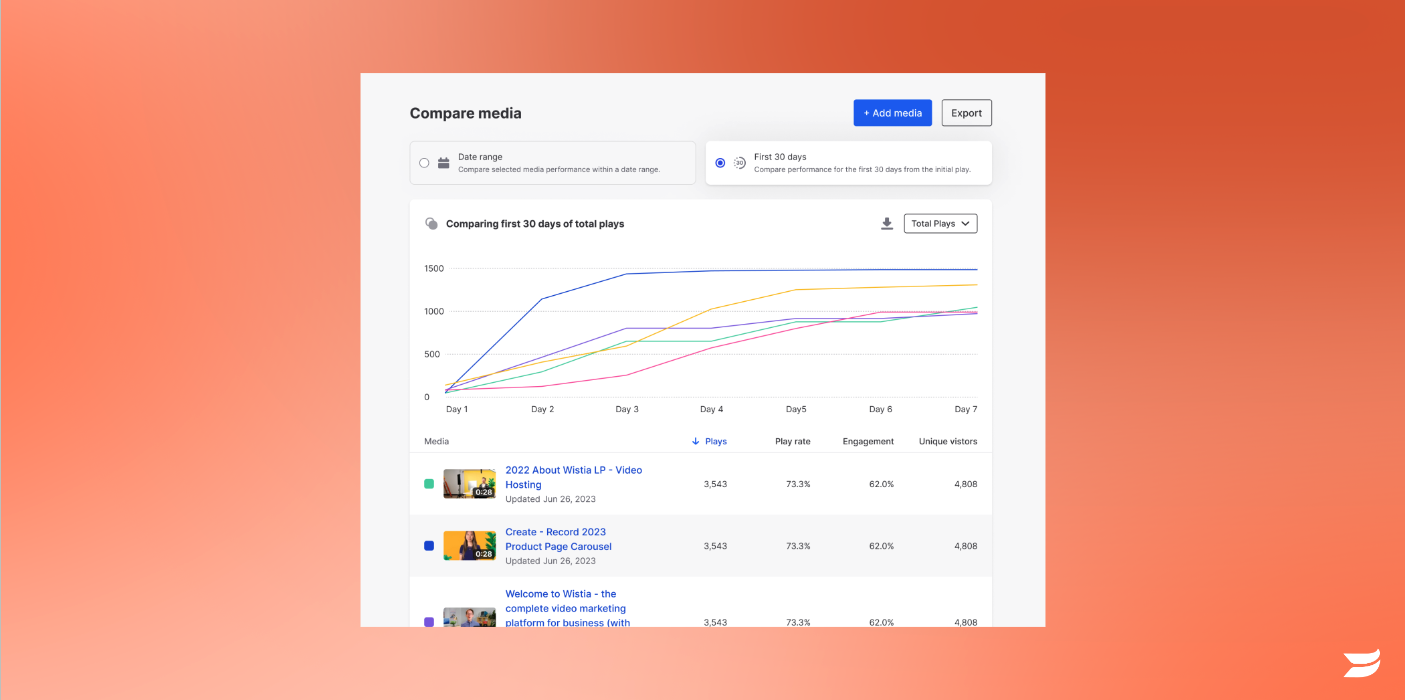
Compare media from the same starting point.
Focus on the crucial early days for timely optimizations.
Benchmark with intuitive relative time comparisons.
How It Works:
Choose the "First 30 Days" option for relative time comparison.
Use the dropdown menu in the chart to view daily Total Plays and Total Time Played.
The table below shows total values and additional metrics for the 30-day period.
Additional Features:
Download Chart: Save the chart as an image.
Export Data: Export your first 30-day media comparison.
Start optimizing your media campaigns today!
Now you can;
Compare media from the same starting point.
Focus on the crucial early days for timely optimizations.
Benchmark with intuitive relative time comparisons.
How It Works:
Choose the "First 30 Days" option for relative time comparison.
Use the dropdown menu in the chart to view daily Total Plays and Total Time Played.
The table below shows total values and additional metrics for the 30-day period.
Additional Features:
Download Chart: Save the chart as an image.
Export Data: Export your first 30-day media comparison.
Start optimizing your media campaigns today!
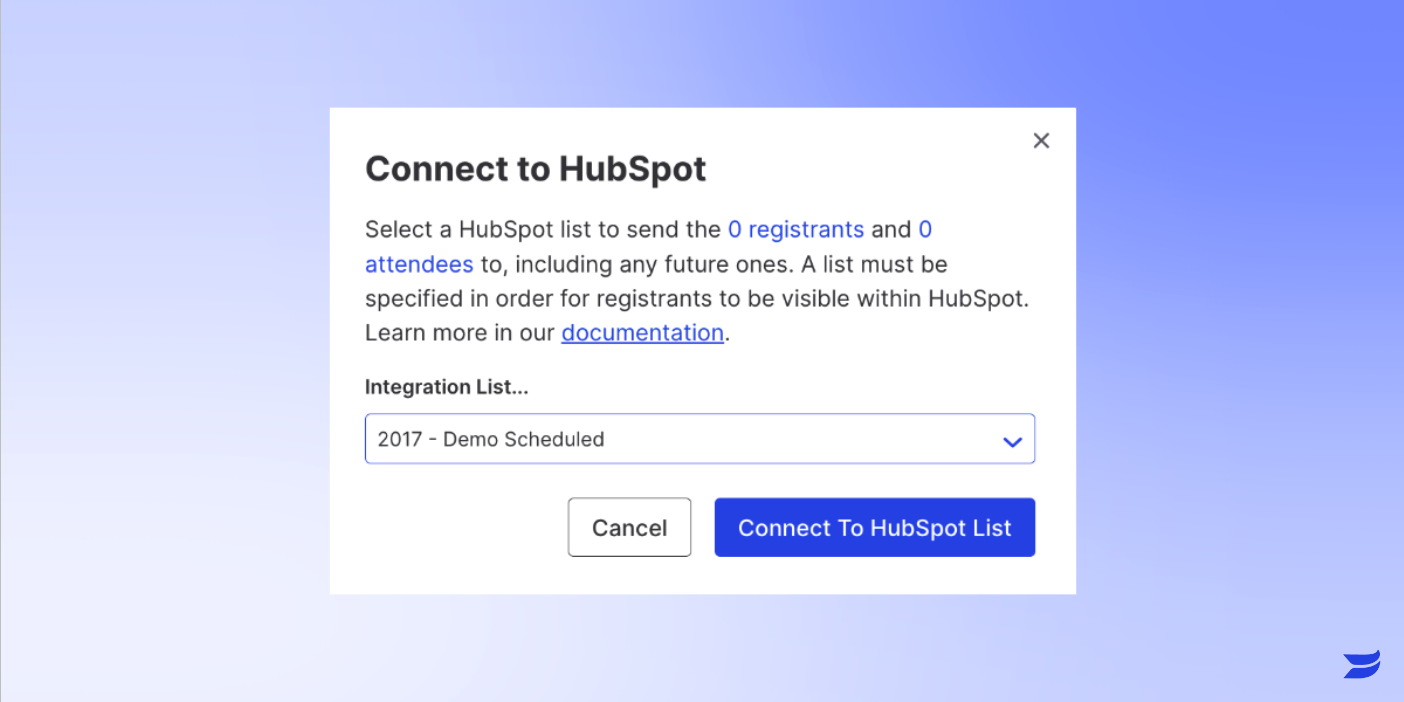
Just head on over to the Registrants page for your Live event and literally click on ‘Connect’ to connect!
]]>
Just head on over to the Registrants page for your Live event and literally click on ‘Connect’ to connect!
]]>Customized event images give you that consistent look from start to finish, with a graphic that can be used from registration page to email. You can use one of your own images or even pull from Unsplash to find the image that’s just right for your event. We’ve even added the option to include a short trailer on your registration page so you can bring your event to life and increase interest and engagement.
And once your attendees are in the event, you don’t have to worry about them getting distracted by the event description. Now the event description has its own button so your audience can pay attention to who’s (and what’s) on stage.
Customize away and make your event shine!
How does it work?
Add an event image for a consistent look from start to finish.
Upload an image in your event overview and then the image will be automatically applied for your registration page, emails, and the screen before the event starts and after it ends (video on demand). Just 1 click to brand your entire event (instead of… 5!)
NEW Hero image resizer
Now you have ability to adjust the size of your hero image on the registration page to make it easier to keep important registration details at the top of the page and ensure people sign up for your event!
Customize your registration page with a short video, custom image or beautiful photography from Unsplash.
Navigate to Event -> Customize menu -> Registration page -> Hero. You will see an option to add a video or an image - one of your own or from Unsplash. If you choose video you can select any of your existing media and customize how the player will look. If you choose an image, it will automatically pull the event image if you set one, but you can always create a unique image just for this page. (don’t worry it won’t impact the image you set for the event thumbnail or emails). Additionally you can browse Unsplash for free high-resolution stock images to find that perfect image for your registration page.
To top it all off, you can choose the layout of the registration page, with the date and registration form on the hero or below the hero.
No more description distractions during your event!
We want your content to shine, which is why we moved the description into a separate section where viewers can choose to read it if and when they want. This feature is rolling out to all users with access to Live: Advanced, Premium, and now customers on the Pro plan.
As always, let us know if you have any feedback.
Happy customization!
Team Wistia
]]>Why Does It Matter?
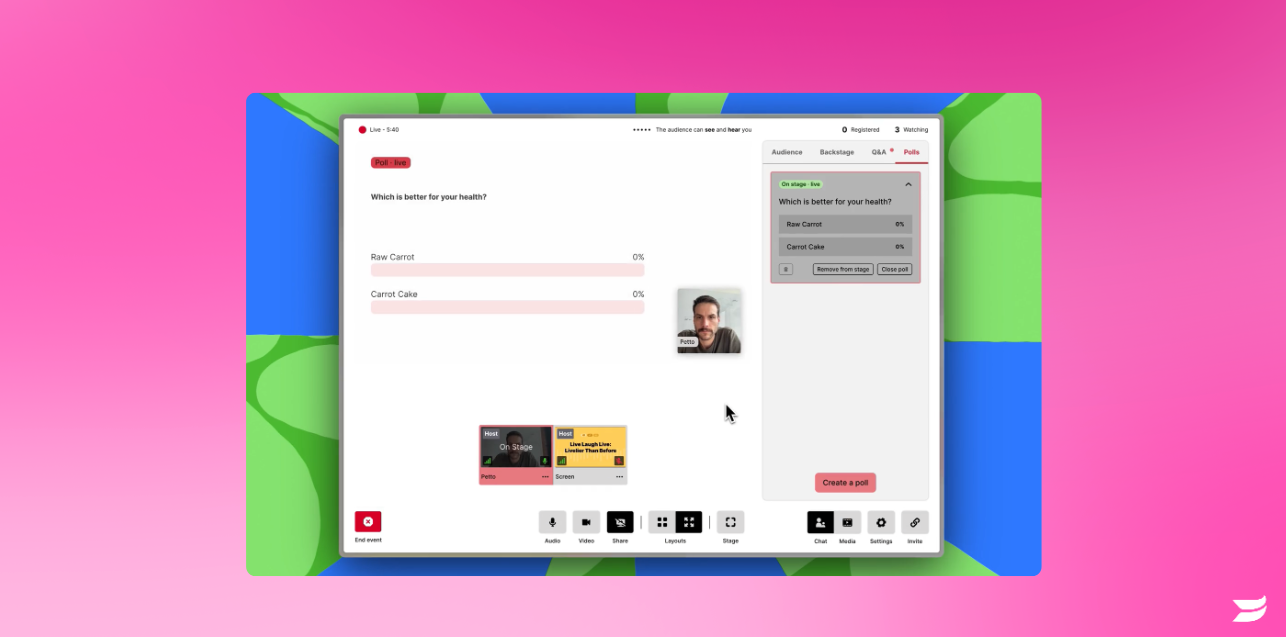
Achieving an engaging webinar event is all about creating opportunities for hosts, panelists, and the audience to interact more dynamically. You can bring polls directly onto the stage in a dynamic, branded layout for maximum visibility and participation.
How Does It Work?
Hosts will see a "Bring to Stage" option under each poll they create.
Clicking this brings the poll questions and answers onto the main stage as a pinned stream.
Hosts can switch between different poll visualizations on stage at any time.
Poll layouts automatically adapt to your Live event's brand colors.
Only one element (poll, screen share, or Q&A) can be displayed on stage at a time.
Polls cannot be deleted while displayed on stage.
Limitations: 280 character limit for questions, 120 characters for answers, maximum of 8 answer options for each poll.
This update provides Wistia Live Premium, Advanced, and Pro customers with an exciting new poll visualization functionality, offering a powerful way to create engaging, interactive experiences for audiences.
Let us know if you have any other feedback!
Team Wistia
]]>Why Does It Matter?
Achieving an engaging webinar event is all about creating opportunities for hosts, panelists, and the audience to interact more dynamically. You can bring polls directly onto the stage in a dynamic, branded layout for maximum visibility and participation.
How Does It Work?
Hosts will see a "Bring to Stage" option under each poll they create.
Clicking this brings the poll questions and answers onto the main stage as a pinned stream.
Hosts can switch between different poll visualizations on stage at any time.
Poll layouts automatically adapt to your Live event's brand colors.
Only one element (poll, screen share, or Q&A) can be displayed on stage at a time.
Polls cannot be deleted while displayed on stage.
Limitations: 280 character limit for questions, 120 characters for answers, maximum of 8 answer options for each poll.
This update provides Wistia Live Premium, Advanced, and Pro customers with an exciting new poll visualization functionality, offering a powerful way to create engaging, interactive experiences for audiences.
Let us know if you have any other feedback!
Team Wistia
]]>
Why Does It Matter?
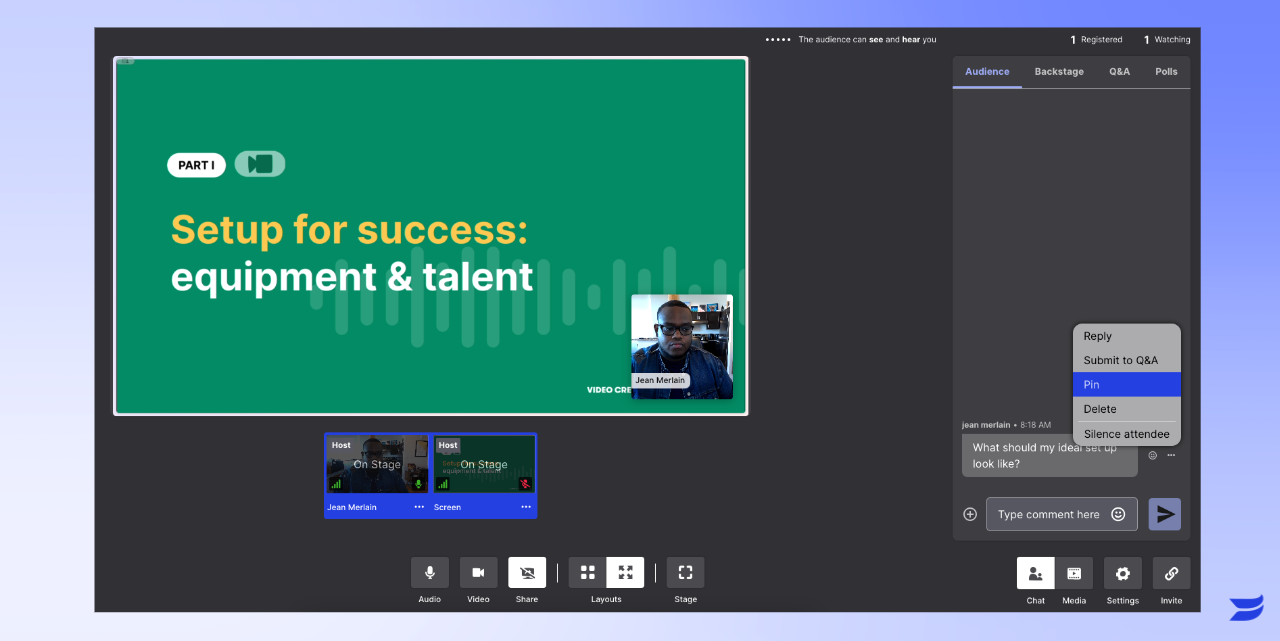
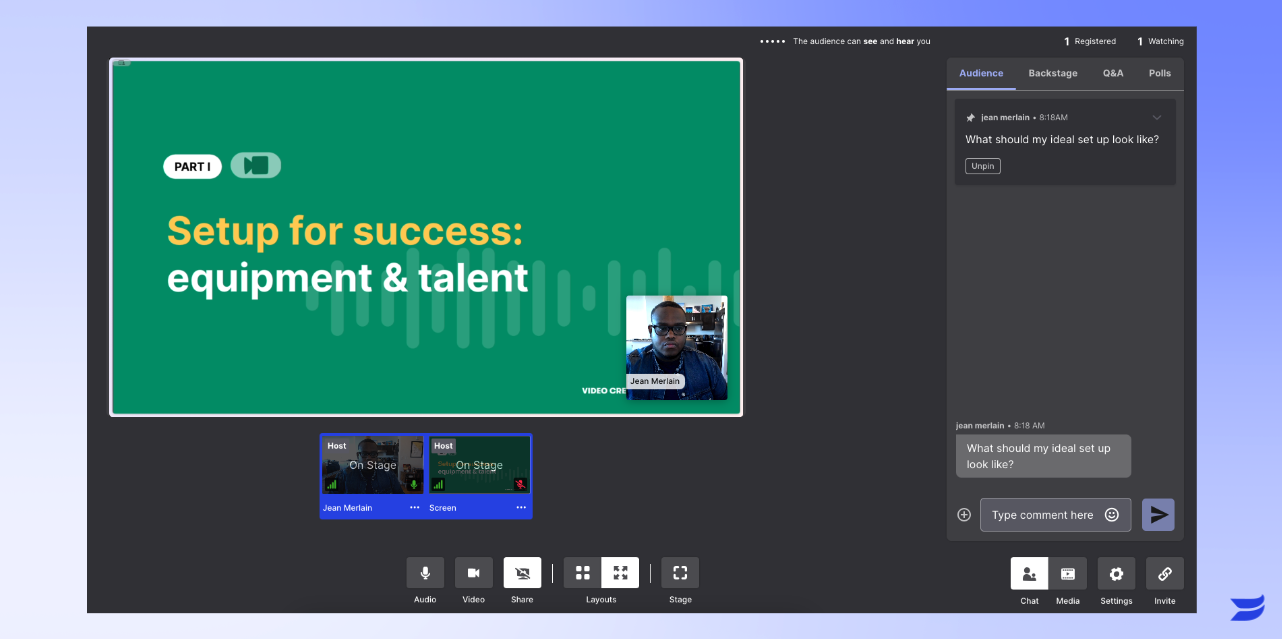
As part of our host confidence-building tools, the ability to pin comments allows you to better engage with your audience and relay important information quickly and efficiently during live streams. Pinned comments remain at the top of the chat indefinitely until unpinned.
How Does It Work?
Only hosts and co-hosts can pin comments in the chat
Pinned comments can include any comments from a host, panelist, or audience member.
There's no limit on the number of comments pinned at once.
Click on a comment to pin it to the top of the chat panel
Click on a pinned comment to unpin it
This update gives you more control over the chat experience and better tools to facilitate an engaging two-way dialogue during your Wistia Live events.
Available to all Wistia Live Pro, Advanced, and Premium customers.
As always, let us know if you have any feedback.
Team Wistia
]]>Why Does It Matter?
As part of our host confidence-building tools, the ability to pin comments allows you to better engage with your audience and relay important information quickly and efficiently during live streams. Pinned comments remain at the top of the chat indefinitely until unpinned.
How Does It Work?
Only hosts and co-hosts can pin comments in the chat
Pinned comments can include any comments from a host, panelist, or audience member.
There's no limit on the number of comments pinned at once.
Click on a comment to pin it to the top of the chat panel
Click on a pinned comment to unpin it
This update gives you more control over the chat experience and better tools to facilitate an engaging two-way dialogue during your Wistia Live events.
Available to all Wistia Live Pro, Advanced, and Premium customers.
As always, let us know if you have any feedback.
Team Wistia
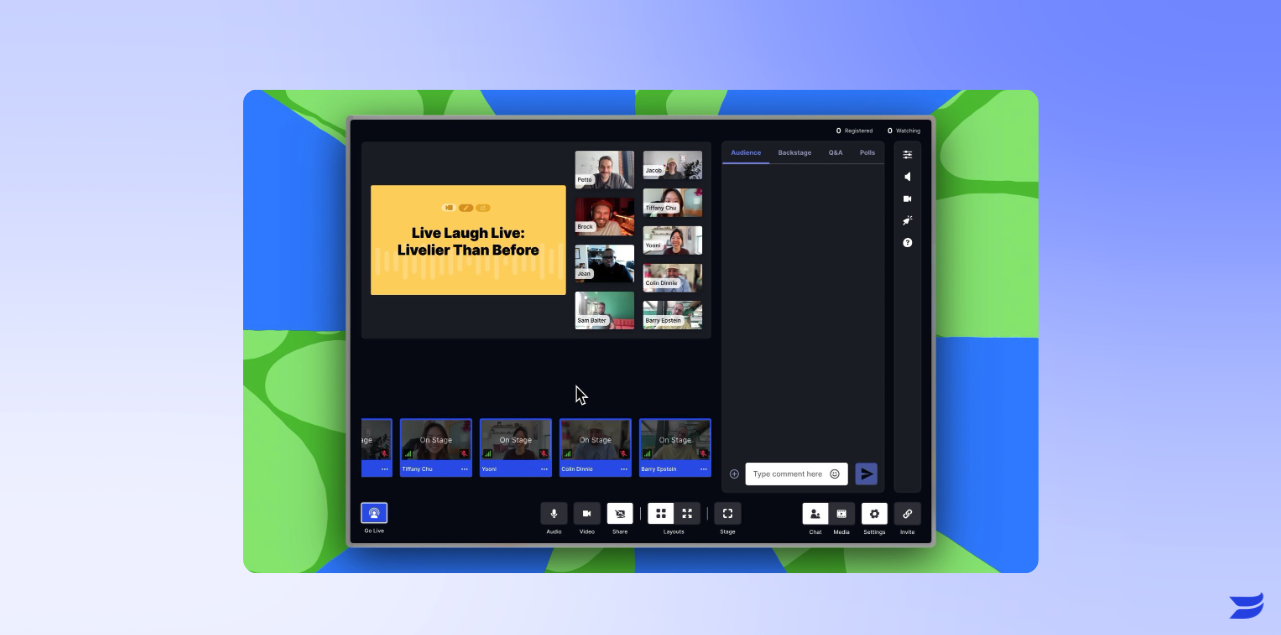
]]>What's New?
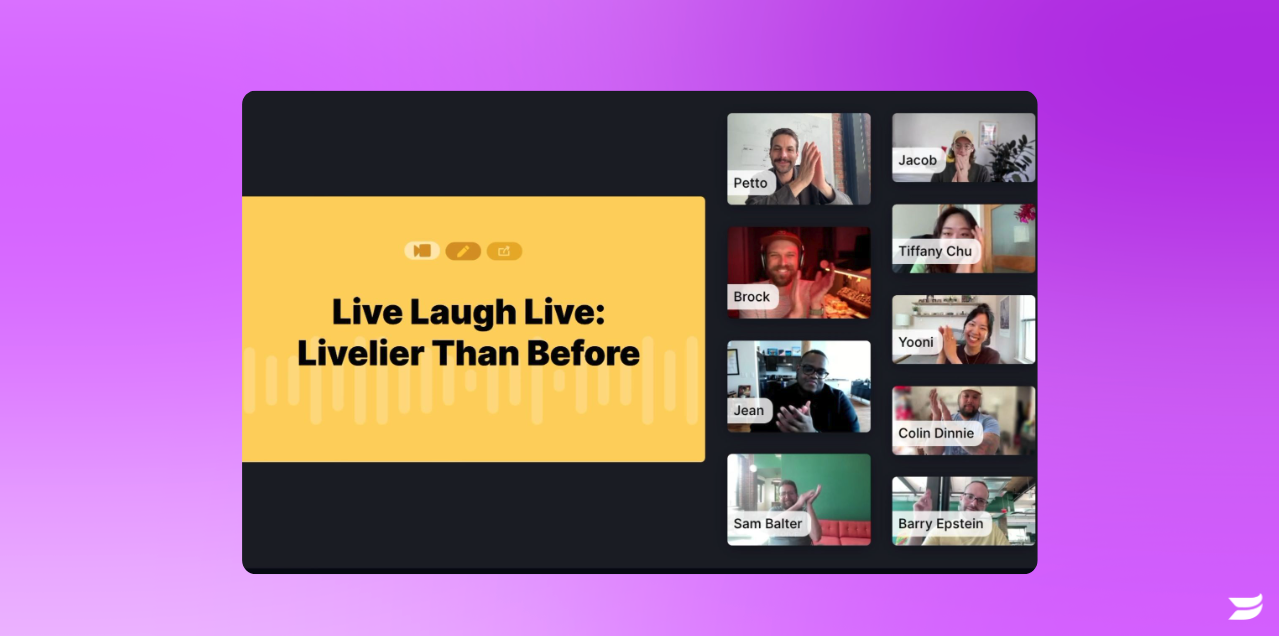
Hosts can now dynamically bring up to 9 panelists on stage simultaneously during a live event.
Why Does It Matter?
This game-changing update allows for much more interactive and engaging virtual events. Having up to nine panelists on stage at once makes it easier than ever to host dynamic discussions, Q&As, panels, and more—all without having to juggle moving people on and off the stage. It's perfect for town halls, all-hands meetings, panel-focused webinars, and any event that requires multiple presenters.
Plus, the ability to share your screen while live makes demos, slide presentations, and collaborative workflows a breeze during your webinars.
How Does It Work?
During your Wistia Live event, click on any panelist's stream to add them to the main stage with you. Up to 9 panelists can join you on stage at any given time. To share your screen, click the "Share Screen" button then bring that screen on stage.
This powerful new functionality is available at no additional cost to all Wistia Live Pro, Advanced, and Premium customers.
Elevate your webinar game today by taking advantage of more interactive stage presentations and screen sharing with Wistia Live.
As always, let us know if you have any feedback.
Team Wistia
]]>What's New?
Hosts can now dynamically bring up to 9 panelists on stage simultaneously during a live event.
Why Does It Matter?
This game-changing update allows for much more interactive and engaging virtual events. Having up to nine panelists on stage at once makes it easier than ever to host dynamic discussions, Q&As, panels, and more—all without having to juggle moving people on and off the stage. It's perfect for town halls, all-hands meetings, panel-focused webinars, and any event that requires multiple presenters.
Plus, the ability to share your screen while live makes demos, slide presentations, and collaborative workflows a breeze during your webinars.
How Does It Work?
During your Wistia Live event, click on any panelist's stream to add them to the main stage with you. Up to 9 panelists can join you on stage at any given time. To share your screen, click the "Share Screen" button then bring that screen on stage.
This powerful new functionality is available at no additional cost to all Wistia Live Pro, Advanced, and Premium customers.
Elevate your webinar game today by taking advantage of more interactive stage presentations and screen sharing with Wistia Live.
As always, let us know if you have any feedback.
Team Wistia
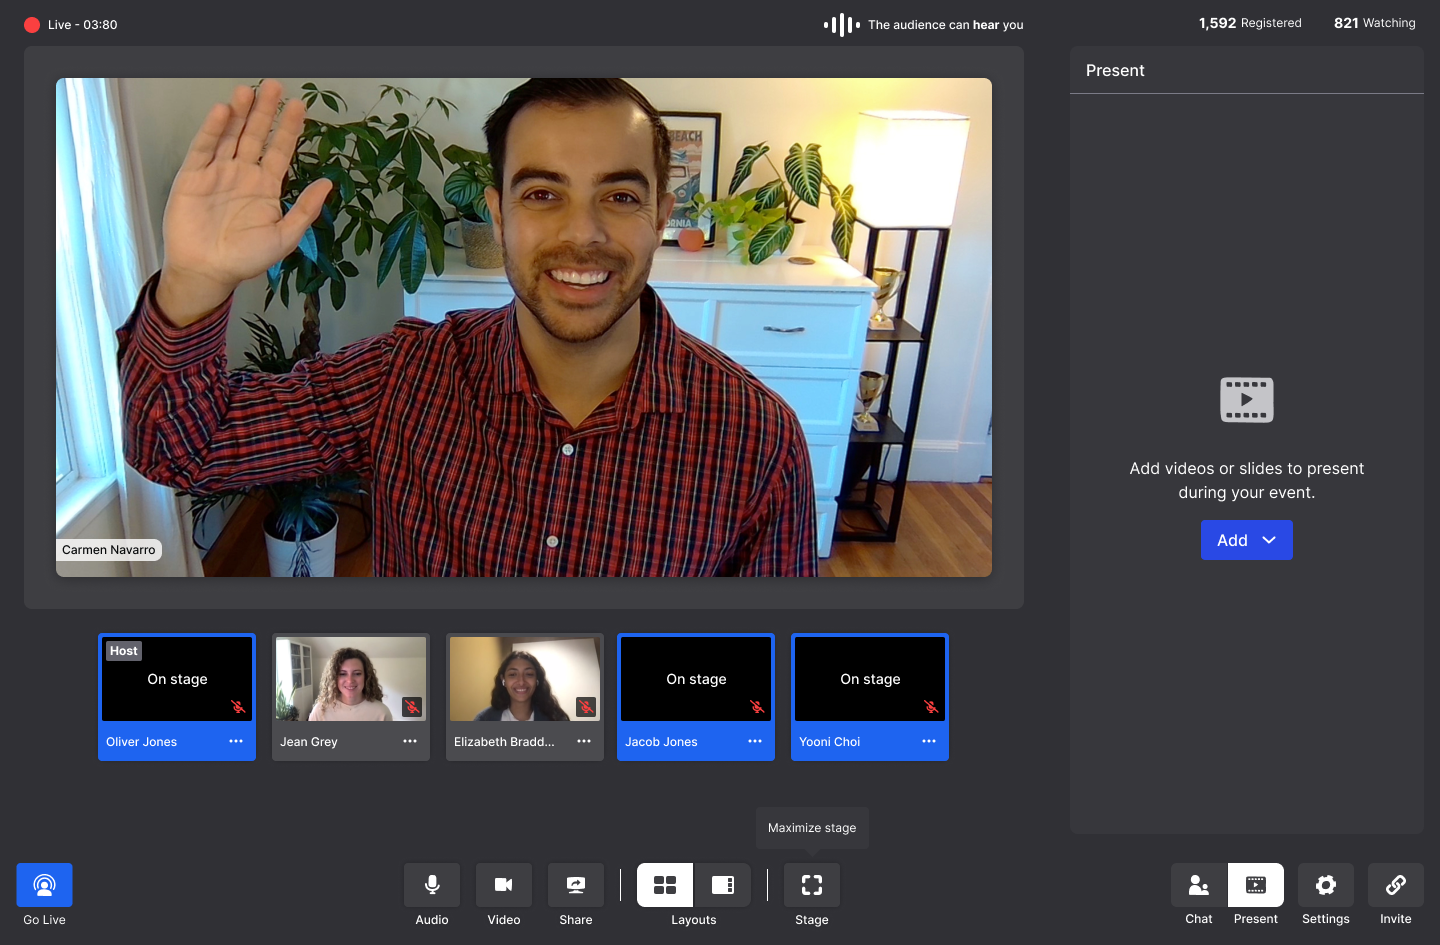
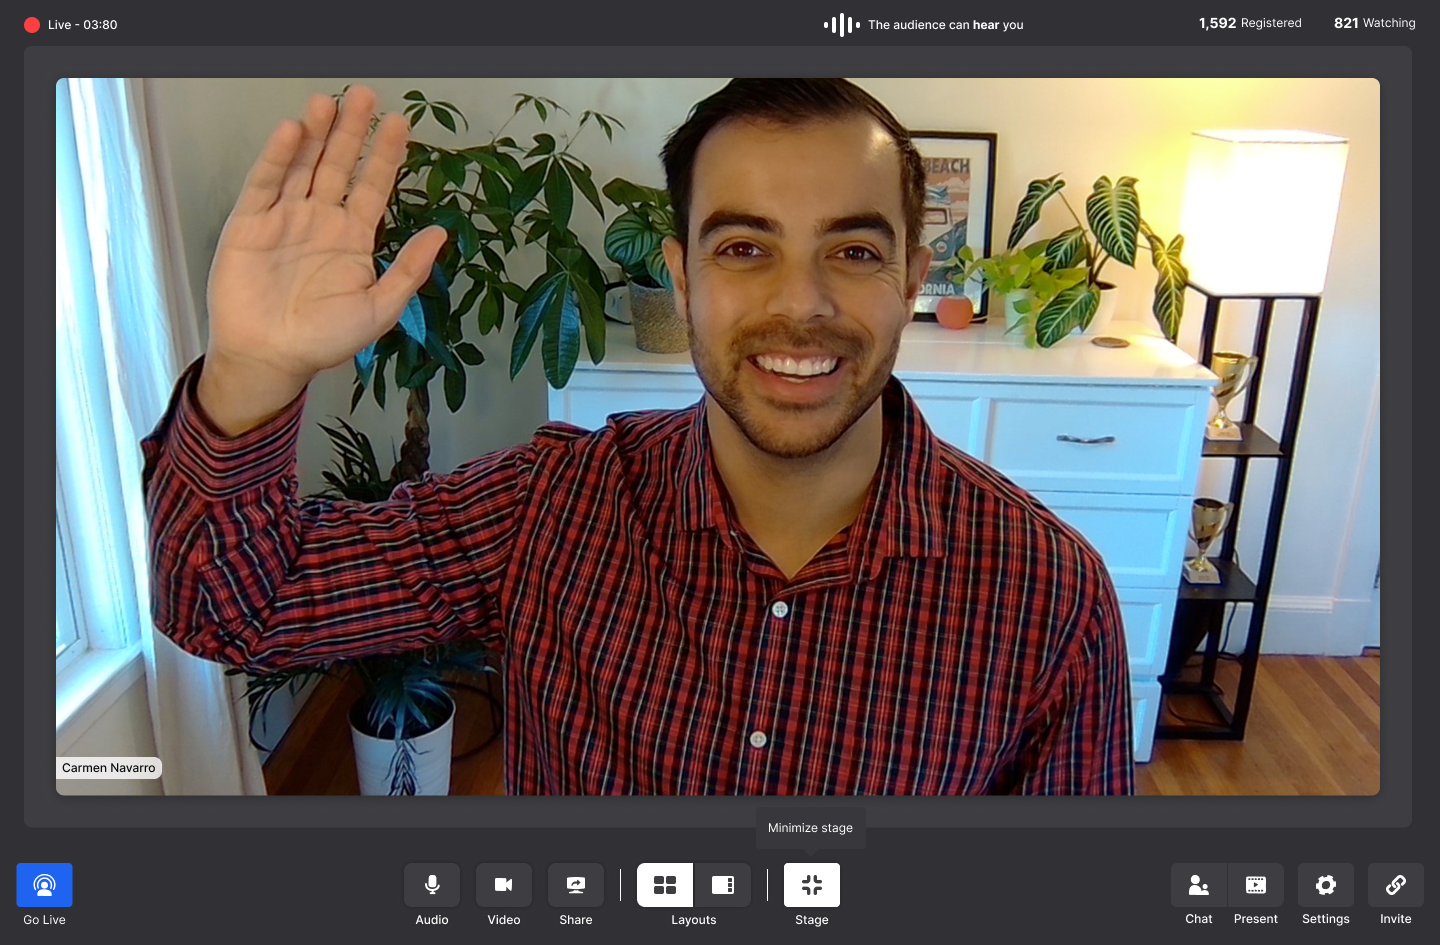
]]>Hosts and panelists can now maximize and minimize their view of the Stage during a Live Event.
Why does it matter?
This feature allows hosts and panelists to better focus on presenting by maximizing the Stage view to match what the audience sees. Maximizing removes potential distractions like the chat panel and backstage streams. It provides more confidence and control during live sessions.
How does it work?
At the bottom of the Stage, you can find the button to “maximize the stage.” By clicking on this, hosts and panelists can maximize the Stage at any time, hiding the chat panel and backstage from their own view only.
Maximizing does not impact the audience's view of the event
Hosts and panelists can minimize the Stage view to restore the chat panel and backstage streams in their interface
Minimizing also only affects the host/panelist's own view
This feature is available to all Pro, Advanced, and Premium Wistia Live customers.
Team Wistia
]]>Discovering more about your audience isn't just about lead quality—it's about elevating how you connect and communicate with them.
Here’s what’s new:
1️⃣ Create custom questions to learn more actionable information about your audience right within your Wistia registration forms.
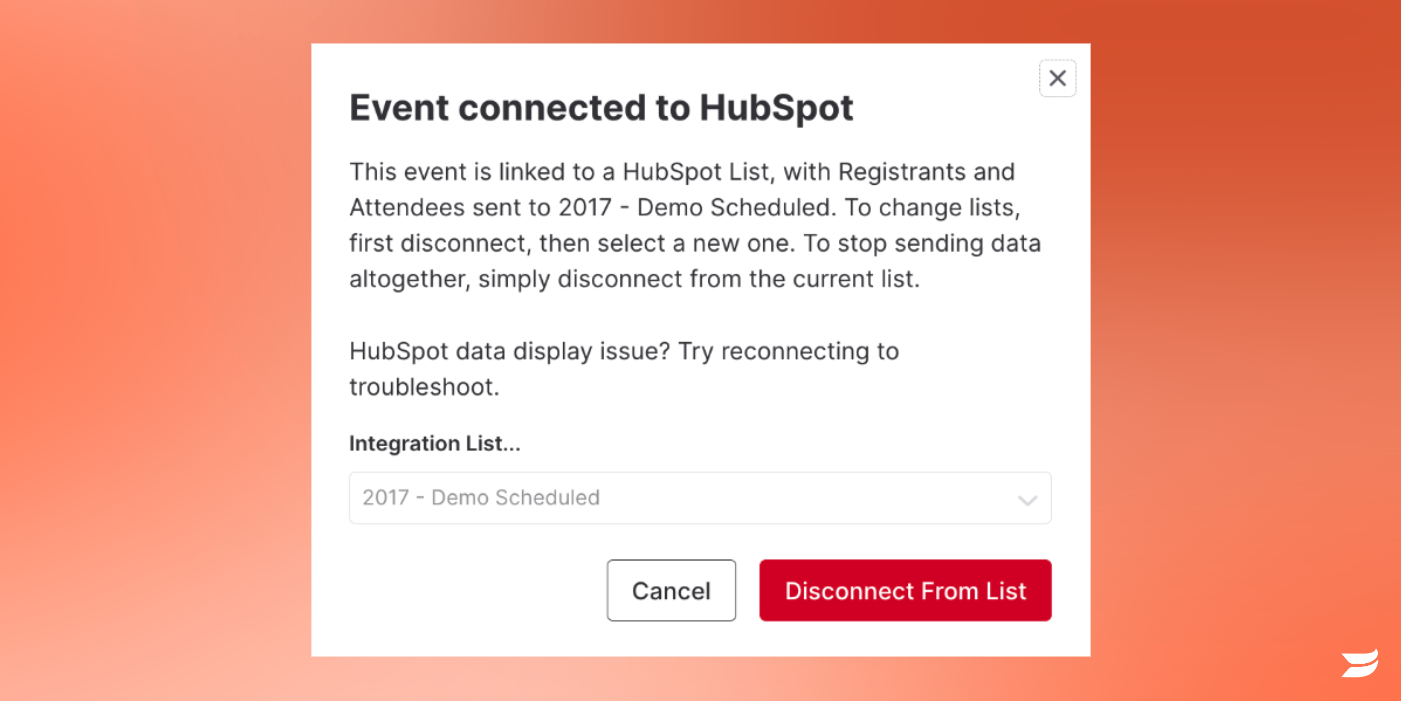
2️⃣ Easily access responses to your custom questions directly within Wistia (under Registrants).
3️⃣ Sync responses to HubSpot, Adobe Marketo Engage, and Pardot and let the automation magic happen! 🪄
Check out this Help Doc to learn more about how to add custom questions to registration and transform your webinar game today!
Discovering more about your audience isn't just about lead quality—it's about elevating how you connect and communicate with them.
Here’s what’s new:
1️⃣ Create custom questions to learn more actionable information about your audience right within your Wistia registration forms.
2️⃣ Easily access responses to your custom questions directly within Wistia (under Registrants).
3️⃣ Sync responses to HubSpot, Adobe Marketo Engage, and Pardot and let the automation magic happen! 🪄
Check out this Help Doc to learn more about how to add custom questions to registration and transform your webinar game today!