🔥 Your webinar engagements, visualized: Heatmaps are here!
1743201472892
When it comes to webinars, knowing who showed up is just the start. Now, you can see how each person engaged with heatmaps for every attendee in your webinar.
This update adds a powerful visual layer to show you when each attendee was most engaged during your event, helping you quickly identify high-intent leads, spot drop-off points, moments of peak interest, and everything in between.
What's new?
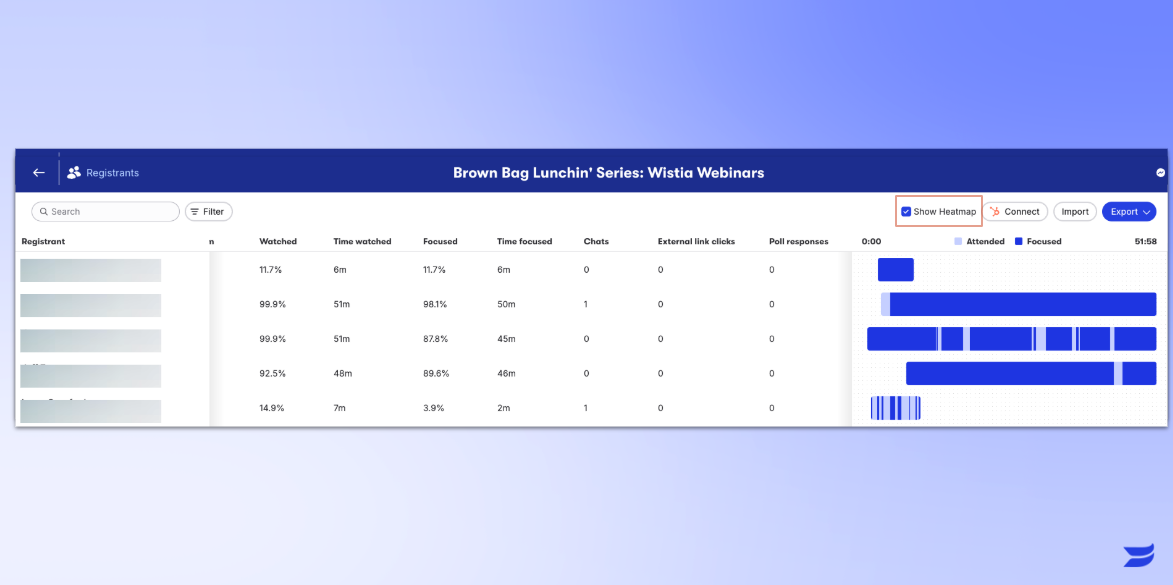
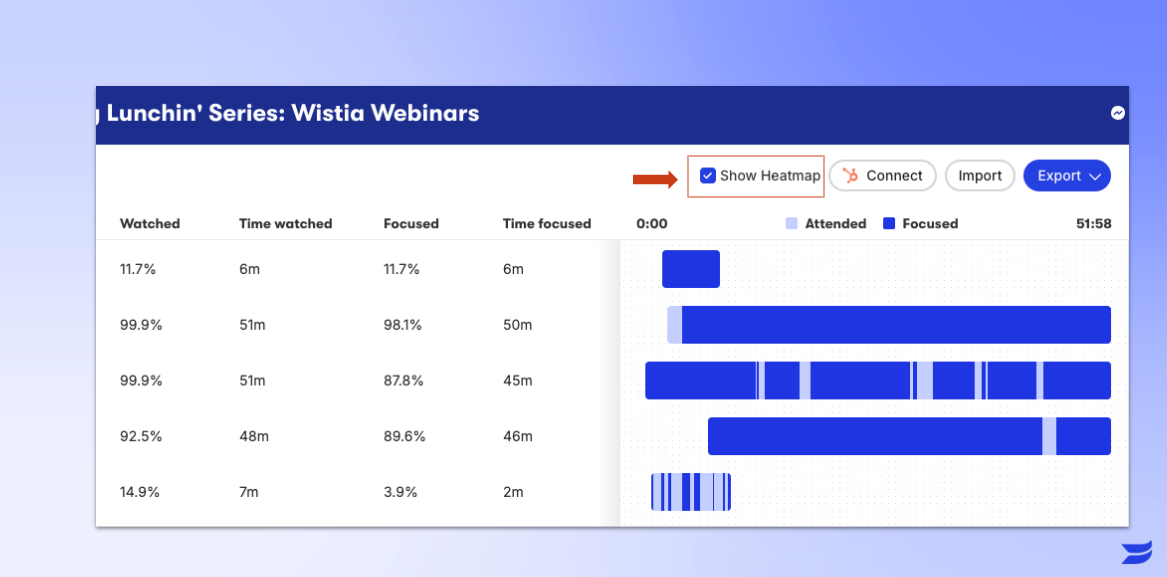
Engagement, visualized – Every attendee now has a heatmap that shows how much of the webinar they've watched and highlights segments where they were especially focused.
Spot key audience trends – Quickly scan heatmaps to identify your most engaged attendees and the moments when people tuned out.
Deep dive into attention levels – Hover over a heatmap for a detailed breakdown of engagement across the entirety of the event.
Full-screen exploration – The audience table now takes over the entire screen, giving you a clear, event-wide view of attendee engagement.
How it works:
Go to your webinar and click Registrants from the left-hand menu.
Hover over any attendee to view their full engagement heatmap.
See precise moments in the event with timestamps and thumbnails when you hover.
Sort by clicking on Attended and Focused headers to easily identify highly engaged attendees.
Who gets it?
This feature is available now for Pro, Advanced, and Premium customers using Wistia registration forms on events created after January 23, 2025.
Have Questions? Our support team is happy to help!
-Team Wistia
Did you like this update?
![]()
![]()
![]()
Leave your name and email so that we can reply to you (both fields are optional):